Salt Marsh
Salt Marsh
How many acres of salt marsh habitat are there in the towns of the Piscataqua Region Watershed and how are the marshes responding to sea-level rise?
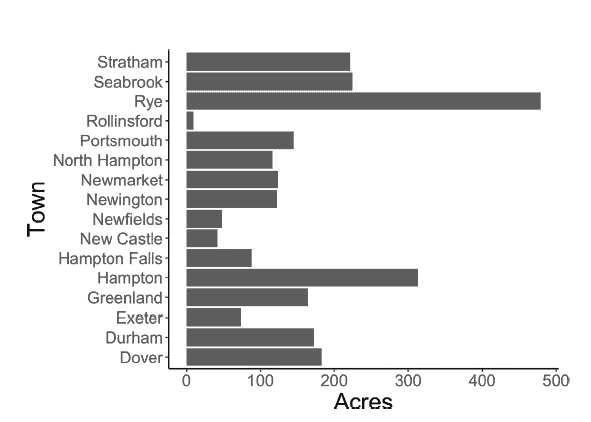
There are 5,711 acres of tidal marsh habitat in the New Hampshire portion of the Piscataqua Region Watershed. These acres are distributed among 16 towns, with the greatest amount in Hampton (1,429 acres) and Seabrook (1,189 acres). Between 1900 and 2010, an estimated 1,045 acres of salt marsh in New Hampshire was lost to development or inadequate tidal flow.12 Although changes in overall acreage since the 2018 report are negligible, existing salt marshes are threatened by sea-level rise and the spread of the invasive common reed (Phragmites australis).
The 2018 State of Our Estuaries report focused on acreage, and there has been little change in the number of acres of salt marsh in the Piscataqua Region Watershed. However, new data allowed for better assessment of marsh resilience to sea-level rise, which is the most immediate stressor for salt marshes. Not surprisingly, the areas with the most extensive marshes, such as Rye and the Hampton-Seabrook Estuary, are also the areas showing the most resilience to sea-level rise. On the other hand, marshes surrounding the Great Bay Estuary as well as marshes in the Portsmouth and Newington areas, are the least resilient to rising seas. This indicator focuses on salt marshes in New Hampshire as we do not have sufficient data for Maine at this time.
Metrics that indicate resilience to sea-level rise include: the relative proportion of high to low marsh; the ratio of unvegetated to vegetated areas; and the acreage of marsh migration pathways, which show potential for a marsh to move inland in the future.
Proportion of High to Low Marsh, by Region and Community
The boundary between high and low marsh is notable as a vegetative demarcation of local mean high-water level. Changes in the location of this boundary are one of the earliest ecological indicators of climate change. If there is enough suspended sediment available, salt marshes can build up peat and maintain their elevation relative to rising sea levels. Salt marshes can also migrate inland as sea-level rises. If barriers prevent migration and the marsh cannot accrete vertically at a rate that keeps up with sea-level rise, change will take place in two stages. First, the relative proportion of low marsh will increase and slowly take over the area occupied by high marsh. Second, eventually the entire marsh will become “squeezed” against the barrier and slowly convert to intertidal mudflat.
Regionally, the Great Bay Estuary has the highest proportion of low marsh. These systems could be starting to experience flooding and may not be able to keep up with sea-level rise (Figure 4.1). Thus, projects that aim to enhance marsh resilience in this Estuary are particularly important to pursue.
Extensive high marsh meadows can be found in Rye and the Hampton-Seabrook Estuary, in contrast to the mainly fringing marshes along many of the tidal rivers and Great Bay shorelines. Meadows in Exeter, Portsmouth, and Stratham have a greater proportion of high marsh and are currently keeping up with sea-level rise more effectively than those in Dover (Figure 4.2). An example of a marsh that is dominated by low marsh, demonstrating it is not keeping up with sea-level rise, can be seen when driving on Route 4 along Bunker Creek in Durham. Over 80% of this site is low marsh; it cannot migrate inland due to the high-sided natural topography of the surrounding upland.
The Unvegetated to Vegetated Ratio of a Marsh
The amount of plant coverage on a salt marsh in comparison to the amount of bare earth and standing water is an important indicator of its vulnerability to relative sea-level rise. This Unvegetated to Vegetated Ratio (UVVR), has been found to be highly correlated with net sediment budget and helps to determine if a marsh is building up vertically and laterally or eroding and starting to “drown.” It has been found that marshes with a UVVR above 0.15 start to become unstable and are at a tipping point to drowning and/or lateral contraction.13
Over 89% of marshes in New Hampshire have a UVVR of 0.15 or less, so most New Hampshire marshes are not showing signs of vulnerability to sea-level rise according to this metric (Figure 4.3). Portsmouth and Newington have marshes with the highest average UVVR values of 0.38 and 0.32 respectively. The marsh that fringes the eastern portion of South Mill Pond in Portsmouth has the highest UVVR by far in the state of New Hampshire. It is bounded by roads, a parking lot, and a tennis court.
Marsh Migration Potential
If a marsh abuts low-lying topography, it has potential to migrate inland and keep up with relative sea-level rise. Consequently, these migration pathways are good places to target land protection projects.
Rye and Hampton have the largest acreage of migration pathway and, therefore, have the highest potential for new salt marsh formation (Figure 4.4). The largest unhindered area in New Hampshire is the low-lying forest surrounding Fairhill Marsh in Rye. In Great Bay, the largest migration pathways lie at the mouth of the Squamscott River.
Beyond the size of marsh migration space, land cover type within this low-lying upland edge determines how easily a tidal wetland can migrate inland.14 For example, it is much easier for a salt marsh to spread into a neighboring brackish or freshwater marsh as sea-level rises than a low-lying developed area such as a paved parking lot.
Acknowledgments and Credits
Rachel Stevens (GBNERR/NHFG), with contributions from Katie Callahan (NHFG), Chris Peter (GBNERR/NHFG), David Burdick (UNH), Kevin Lucey (NHDES), Adrienne Kovach (UNH), Neil Ganju (USGS), and Alyson Eberhardt (NH Sea Grant/UNH Extension). Graphics by Rachel Stevens.
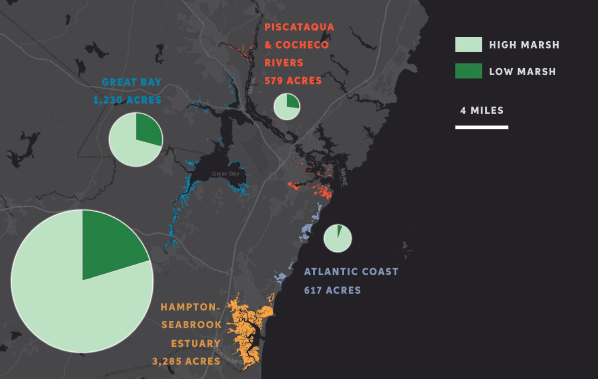
Figure 4.1: Overall acreage and proportion of high and low salt marsh in different regions New Hampshire. Marshes in Great Bay have the highest proportion of low marsh showing they are least able to keep pace with sea-level rise. Data source: Great Bay National Estuarine Research Reserve
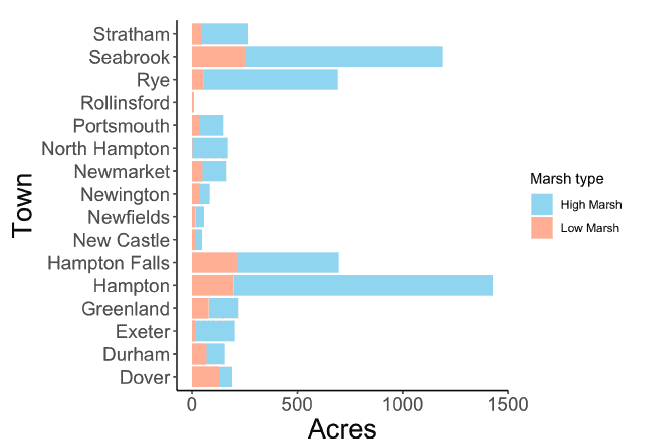
Figure 4.2: The acreage of salt marsh in coastal communities of New Hampshire. Data source: Great Bay National Estuarine Research Reserve
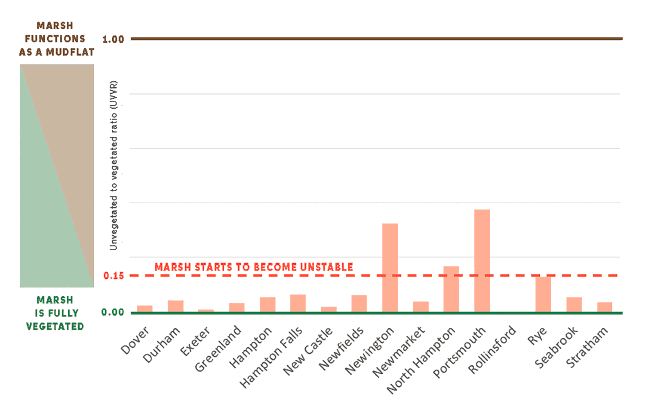
Figure 4.3: The unvegetated ratio to vegetated ratio of marshes for communities in New Hampshire. A marsh with a UVVR of 0.0 is entirely covered by vegetation, while a marsh with a UVVR of 1.00 or more is so sparsely vegetated it is effectively functioning as a mudflat. Data source: Great Bay National Estuarine Research Reserve
