Phytoplankton
Phytoplankton
How are phytoplankton concentrations changing over time?
Stations in Great Bay indicate an increase in chlorophyll-a (a proxy for phytoplankton) over time, peaking around 2010 through 2015, with levels dropping off in recent years. Other stations indicate either no trend or decreasing chlorophyll-a concentrations. Chlorophyll-a concentrations in Hampton River in recent years (2020 – 2021) are mostly at levels that indicate “good” water quality. Phytoplankton levels should be considered together with total suspended solids, because the two components combine to impact how much light gets to the bottom of our estuaries (see “Total Suspended Solids” and “Light”).
Extracted chlorophyll-a measurements were compared among six locations in the Great Bay Estuary (Figure 12.1). Both the Adams Point and Great Bay Stations (Figure 12.2; Table 12.1) indicate statistically significant increasing trends while the Squamscott River (Figure 12.3) and Oyster River Stations indicate statistically decreasing trends (Table 12.1). These differences could be due to when these various time series began. For example, only the Adams Point Station includes data from the late 1980s and early 1990s, a period when chlorophyll-a levels were low. The Upper Piscataqua River Station time series only extends back to 2007 and there have been no detectable trends (Figure 12.4). Similarly, the time series for the Hampton River Station began very recently (2018) and does not exhibit a clear trend (Figure 12.5).
At all stations investigated, chlorophyll-a concentration ranged from less than 1 μg/L to approximately 40 μg/L and there were significant trends in chlorophyll-a at four of the seven stations (Table 12.1). The longest time series is for Adams Point and illustrates the pattern of low levels at the beginning of the record (1988 through 2002) with higher levels over the last two decades (Figure 12.2). Currently, this station shows a statistically significant increasing trend.
Chlorophyll-a concentrations are regularly used to assess an estuary’s “eutrophication” status: that is, whether the estuary contains excess nutrients. There are no current thresholds specific to our estuaries, but general thresholds do exist for coastal regions of the United States.40 For the Northeast, chlorophyll-a levels less than 5 μg/L are categorized as “low” with regard to eutrophic status, concentrations between 5 and 20 μg/L are “moderate,” and concentrations above 20 μg/L are considered “high.” In general, looking at Figures 12.1 through 12.4, most measurements fall in either the “low” or “moderate” category (encompassing from 0 to 20 μg/L) with some, but infrequent, measurements that are “high.” It is encouraging that the vast majority of measurements are less than 10 μg/L in the most recent years.
Across all locations, chlorophyll-a concentrations were seasonally variable, with a primary peak in the spring (Figure 12.6). Although chlorophyll-a should continue to be tracked, efforts should be made to characterize the dominant phytoplankton communities in estuarine waters consistently over time. This would provide essential information regarding the health of our estuaries, as well as their potential to nutritionally support important fisheries such as oyster aquaculture.
Acknowledgments and Credit
Elizabeth Harvey (UNH), with contributions from Kalle Matso (PREP), Lara Martin (UNH), and Tom Gregory (UNH).
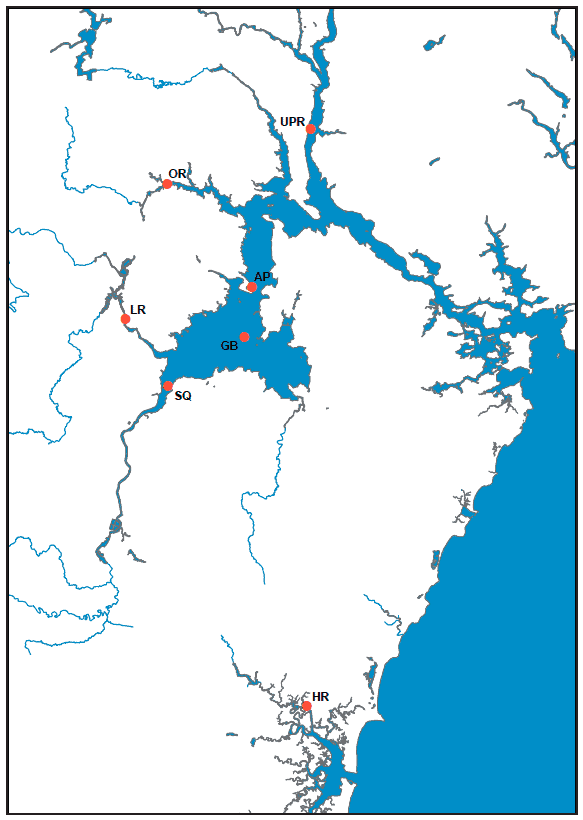
Figure 12.1: Monitoring stations for phytoplankton including Adams Point (AP), Great Bay (GB), Lamprey River (LR), Oyster River (OR), Squamscott River (SQ), Upper Piscataqua River (UPR), and Hampton River (HR)
Data source: Jackson Estuarine Lab, UNH
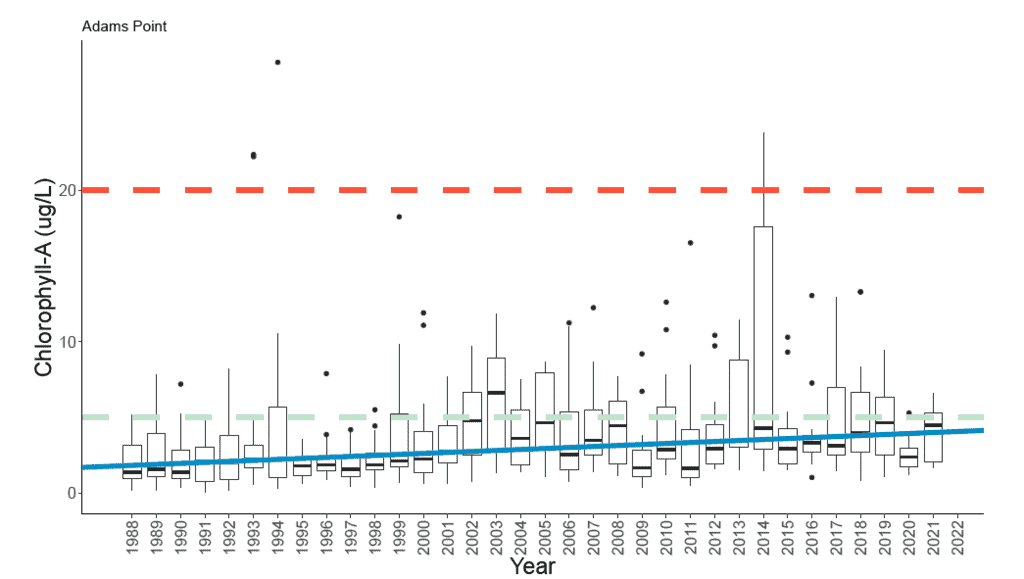
Figure 12.2: Box and whisker plot of chlorophyll-a data at the Adams Point Station (year-round, both low and high tide) from 1988 to 2021. Boxes encompass the middle 50% of the data points. The horizontal line in each box is the median and the vertical whiskers encompass the remaining data. “Outliers” are shown as individual points. In general, measurements below the green dashed line at 5μg/L reflect better water quality. Measurements between 5 and 20μg/L are “moderate” and measurements above the red dashed line (20μg/L) indicate poorer water quality. The blue trend line indicates a statistically significant increase over time.
Data source: Jackson Estuarine Laboratory, UNH
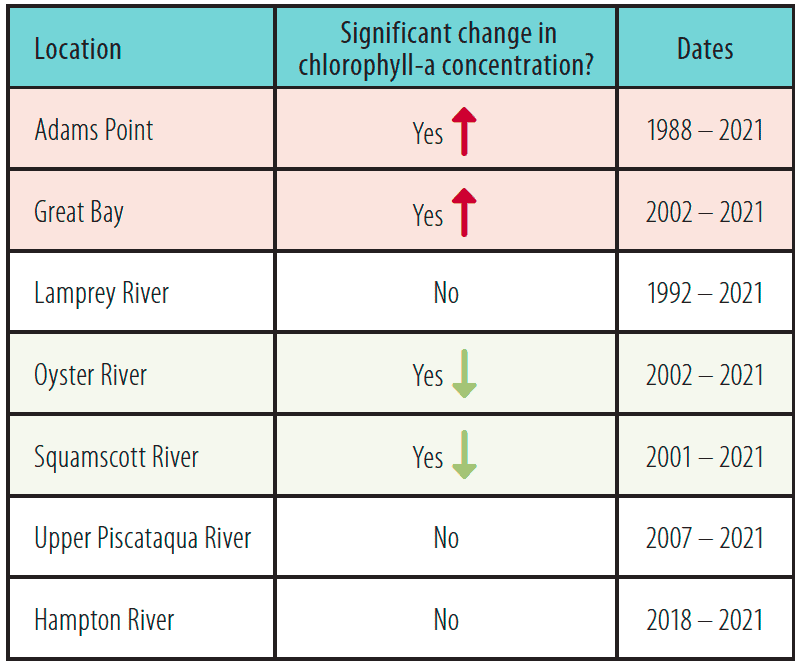
Table 12.1. Summary of analysis of annual change in chlorophyll-a concentrations.
Data source: Jackson Estuarine Laboratory, UNH
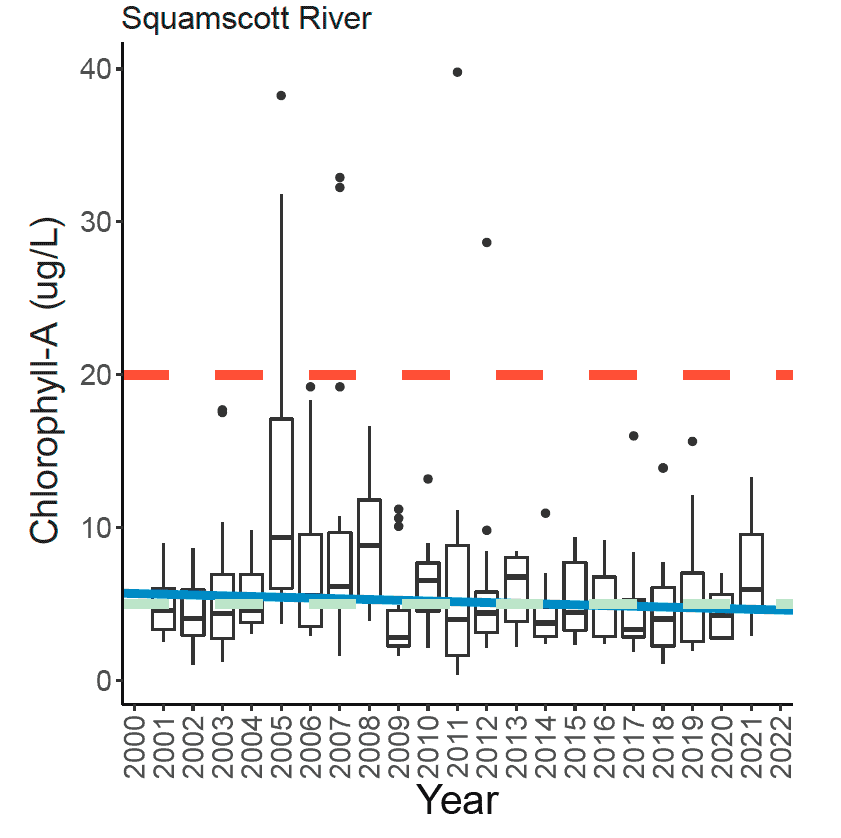
Figure 12.3: Box and whisker plot of chlorophyll-a data at the Squamscott River Station (low tide only) from 2001 to 2021. Boxes encompass the middle 50% of the data points. The horizontal line in each box is the median and the vertical whiskers encompass the remaining data. “Outliers” are shown as individual points. In general, measurements below the green dashed line at 5μg/L reflect better water quality. Measurements between 5 and 20μg/L are “moderate” and measurements above the red dashed line (20μg/L) indicate poorer water quality. The blue trend line indicates a statistically significant decrease over time.
Data source: Jackson Estuarine Laboratory, UNH
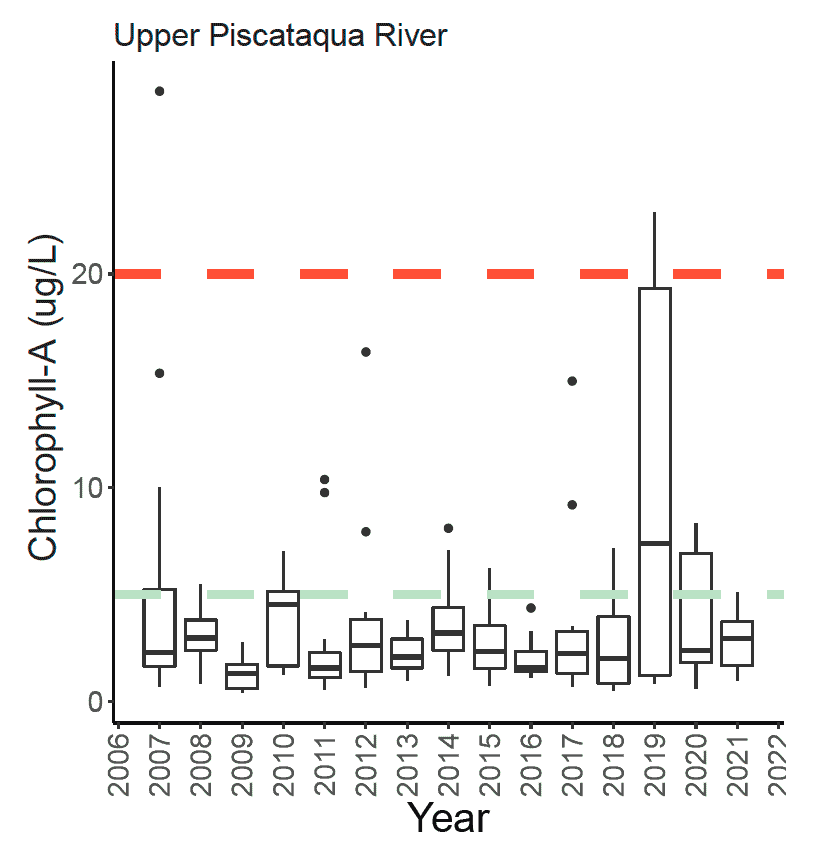
Figure 12.4: Box and whisker plot of chlorophyll-a data at the Upper Piscataqua River Station (low tide only) from 2007-2021. Boxes encompass the middle 50% of the data points. The horizontal line in each box is the median and the vertical whiskers encompass
the remaining data. “Outliers” are shown as individual points. In general, measurements below the green dashed line at 5μg/L reflect better water quality. Measurements between 5 and 20μg/L are “moderate” and measurements above the red dashed line (20μg/L) indicate poorer water quality. There was no statistical trend.
Data source: Jackson Estuarine Laboratory, UNH
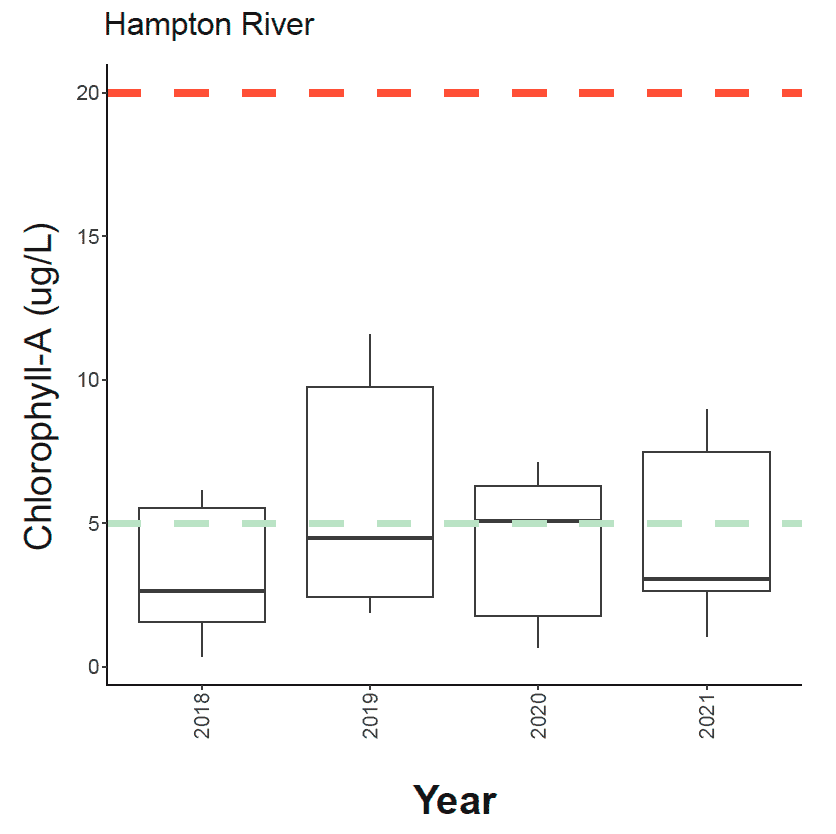
Figure 12.5: Box and whisker plot of chlorophyll-a data at the Hampton River Station (low tide only) from 2018 to 2021. Boxes encompass the middle 50% of the data points. The horizontal line in each box is the median and the vertical whiskers encompass the remaining data. “Outliers” are shown as individual points. In general, measurements below the green dashed line at 5μg/L reflect better water quality. Measurements between 5 and 20μg/L are “moderate” and measurements above the red dashed line (20μg/L) indicate poorer water quality. There was no statistical trend.
Data source: Jackson Estuarine Laboratory, UNH
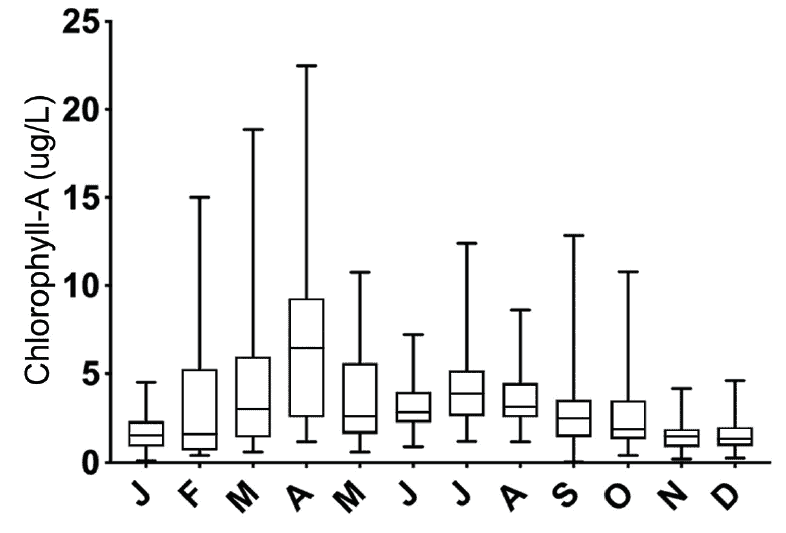
Figure 12.6: Monthly mean of chlorophyll-a concentration at the Adams Point Station (both low and high tide samples). This dataset runs from 1998 – 2020. The line within each box is the mean across all years examined, and whiskers encompass the minimum
and maximum values.
Data source: Jackson Estuarine Laboratory, UNH
Phytoplankton – Extended Report
Includes methods, data, and additional discussion not included in the Printed Edition.