Nutrient concentrations in the water are affected by nutrient loading from the watershed, hydrodynamic mixing, and all the complex uses and transformations by living resources. Although all nutrients are important, nitrogen is most often the limiting nutrient in estuarine watersheds, and therefore, is currently emphasized in our estuaries. As noted in “Nitrogen Loading,” nitrogen inputs since 2012 have been reduced in the Great Bay Estuary in part due to consecutive years of low annual rainfall. In addition, since 2014, several municipalities have improved their wastewater treatment facilities. These changes are expected to have some influence on the concentrations of nitrogen, discussed below.
Although dissolved inorganic nitrogen is an important form of nitrogen because it is taken up most readily by plants and algae, total nitrogen is considered a more accurate measure of the nitrogen status of an estuary because it includes the portion in living biomass.
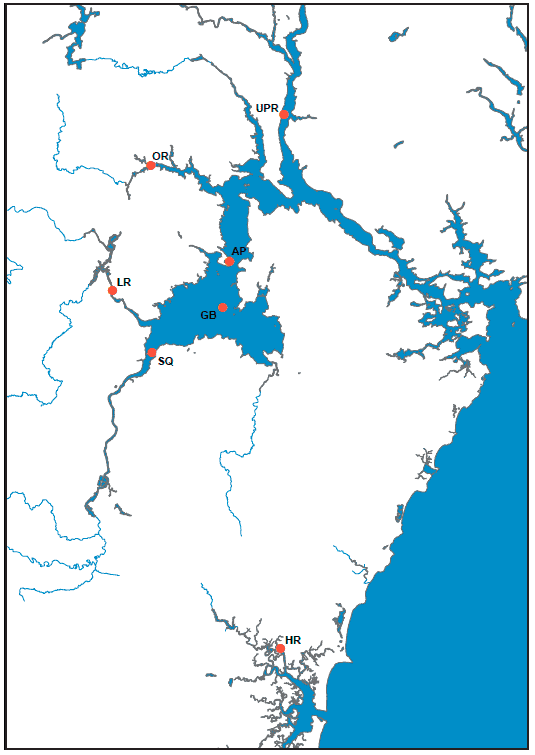
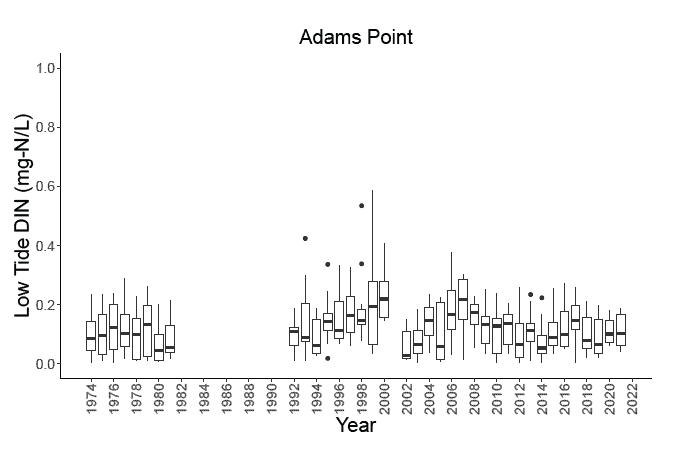
At the Adams Point Station (Figure 8.1) — the site with the longest time series — the earliest and most recent dissolved inorganic nitrogen data are low relative to the rest of the dataset, with the highest values between 1998 and 2016. Median values for dissolved inorganic nitrogen from 2016 to 2020 ranged from 0.10 to as high as 0.15mg/L and were comparable to median values for the years 1974 to 1981. For reference, the EPA National Coastal Assessment Condition Report categorizes values less than 0.1 as “good.” Other categories include “fair” (0.1 to 0.5 mg-N/L), and “poor” (greater than 0.5 mg-N/L). Using this categorization, recent dissolved inorganic nitrogen concentrations at Adams Point vary between the “good” and “fair” categories.
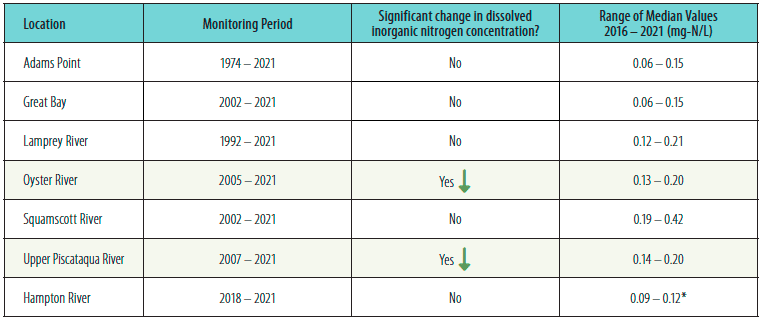
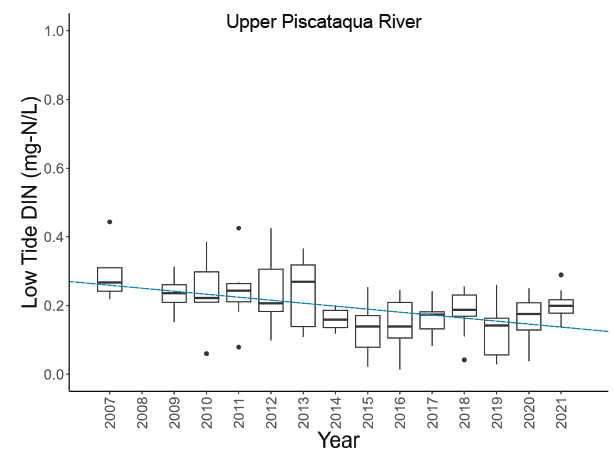
At the Oyster River and Upper Piscataqua River Stations, dissolved inorganic nitrogen concentrations significantly decreased (Table 8.1). This pattern may be attributed to the shorter time series at these stations, which began collecting data between 2002 and 2007. For example, the data for Upper Piscataqua River (Figure 8.2) indicate elevated concentrations during a time period that overlaps with the periods of high values for Adams Point and Lamprey River (between 2007 and 2013).
The time series for the Hampton River Station only goes back to 2018, but the data from this site indicate that dissolved inorganic nitrogen concentrations straddle the “good” and “fair” threshold (Table 8.1). The Hampton River Station has the second lowest levels of nitrogen across the seven stations listed.
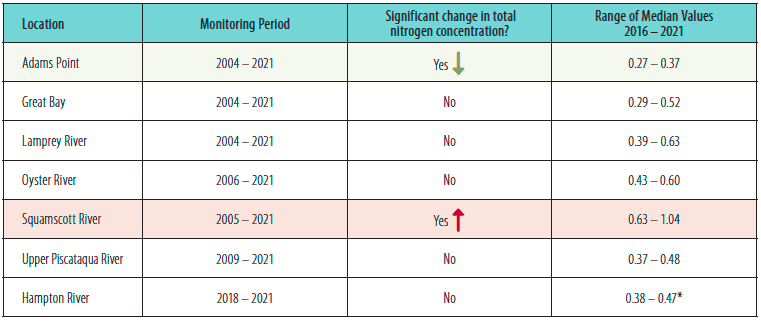
Since 2016, median annual total nitrogen values at Adams Point ranged from 0.27 mg-N/L to 0.37 mg-N/L over the sample season (Table 8.2). A total nitrogen concentration greater than 0.5 mg-N/L was only measured in three sampling months since 2016. For reference, the EPA National Coastal Assessment Condition Report categorizes values less than 0.31 mg-N/L as “low,” values between 0.31 and 0.48 mg-N/L as “moderate,” and values between 0.48 and 0.68 mg-N/L as “high.”31,32
Table 8.2 shows that most values over the past five years fall in the “moderate” category, according to the National Coastal Assessment Condition Report, with the Squamscott River Station standing out as having higher concentrations. It is possible that these high values could come down, however, given the 2020 upgrade of the Town of Exeter Wastewater Treatment Facility.
Relationships between nitrogen concentrations and ecosystem health response vary from estuary to estuary. Currently, researchers are addressing this issue in order to clarify these relationships for our waters.
Acknowledgments and Credit
Anna Mikulis (UNH) and Kalle Matso (PREP), with contributions from Easton White and Jody Potter (UNH).
