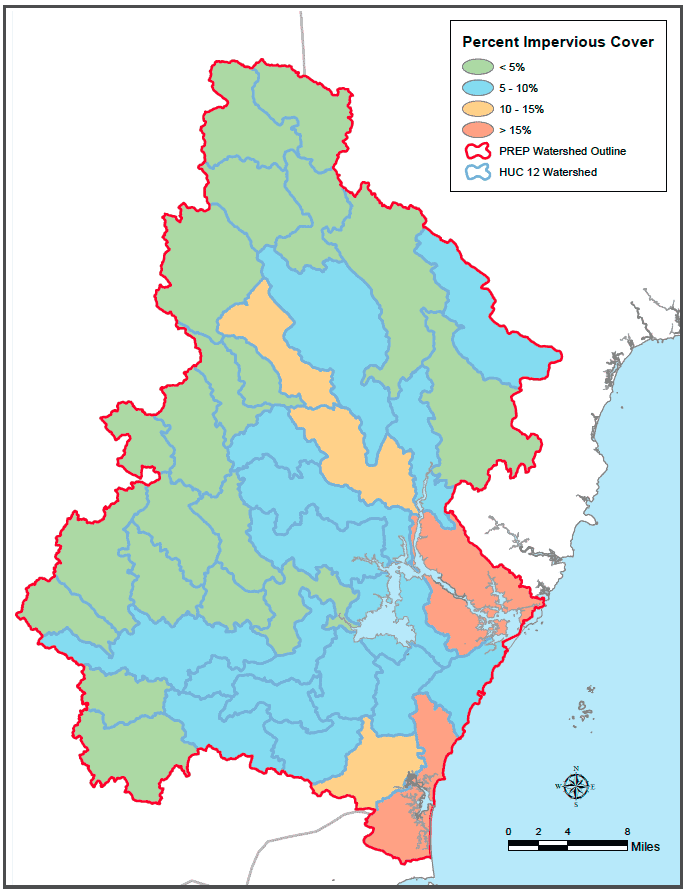
The 2021 update to this dataset is the second iteration of mapping the entire 52-town Piscataqua Region Watershed using high resolution, 1-foot/60-cm orthoimagery. Impervious cover estimates using this approach represent 48,428 acres or 5.8% of the land area. This is an increase of 1,834 acres of impervious cover (0.2% of the Piscataqua Region) since 2015 (when there were 46,594 acres). Watersheds with greater than 10% impervious surface coverage of land area are concentrated in the vicinities of the Hampton-Seabrook Estuary, the Piscataqua River and the Route 16 corridor along the Cocheco River. Impervious surfaces in 2021 in each of the Piscataqua Region subwatersheds are shown as a percentage of land area in Figure 1.1.
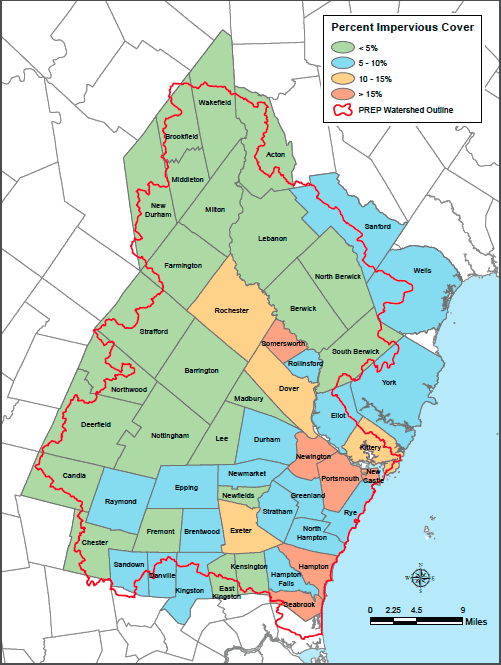
Goals for impervious cover were not met. Two subwatersheds that previously had less than 5% went over the threshold (Bauneg Beg Pond-Great Works River and Isinglass River) and one subwatershed went over the 10% impervious threshold (Middle Cocheco River). Communities with the highest overall impervious cover percentages continue to be Portsmouth (27%), New Castle (21%), and Seabrook (21%), and the largest increases of impervious surfaces between 2015 and 2021 occurred in Wells (160 acres), Rochester (155 acres), Dover (109 acres), York (91 acres), Epping (72 acres), and Sanford (67 acres). Communities with the smallest increases in impervious surfaces included New Castle (2 acres), East Kingston (4 acres), and Portsmouth (4 acres) (Figure 1.2). Small increases in impervious cover in urbanized areas may be a result of limited availability of buildable lots. For information on housing trends in the watershed refer to the “Housing Permits” indicator section of this report. Town-by-town information on impervious surfaces in 2021 is shown in Figure 1.2.
Between 2015 and 2020 the population in the Piscataqua Region Watershed increased 3.9% (15,039 people), and impervious cover increased 4% (1,834 acres). This means that for every one person increase in population, impervious cover increased 0.13 acres or 5,663 square feet; however, impervious cover is not evenly distributed across the watershed. For more discussion on the relationship between municipal populations and impervious cover, see the Extended Report.
Acknowledgments and Credit
David Justice and Chris Phaneuf (NH GRANIT, Earth Systems Research Center), with contributions from Abigail Lyon (PREP) and Kalle Matso (PREP). Graphics from NH GRANIT.

