Housing
Housing Permit Approvals
How many single and multi-family new housing permits were issued by communities in the Piscataqua Region Watershed from 2016 – 2020? How many new housing units were built from 2000 – 2020 in Rockingham, Strafford, and York Counties in the Piscataqua Region Watershed?
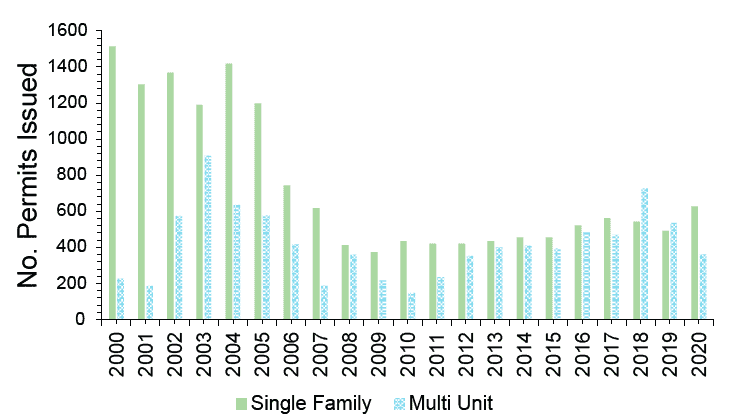
Since 2015, average annual housing permit approvals were 515 for multi-units and 549 for single-family units. In 2020 multi-unit housing permits fell to 361 while single-family permits increased to 628. Since 2000, there were 50,446 new housing units built, a 20% increase from 252,796 units in 2000 to 303,242 units in 2020. The expansion of the housing stock can lead to environmental consequences even if managed sustainably.
Those who live in the Piscataqua Region Watershed know that it is a desirable place to live. Since 2015, this region has experienced an increase in population of 3.9%. While there are substantial economic and cultural benefits of a growing community, increased population can lead to a variety of issues if not managed properly. New construction often increases impervious cover, leading to increased runoff and nutrient loading into the watershed. Improper fertilizer use on lawns, like applying more than is needed or before a rain event, can contribute to increased nutrient loading to our estuaries. Septic systems constructed too close to waterbodies, poorly maintained, or failing can also introduce harmful bacteria into local waterbodies and contribute to nutrient loading. Additionally, an increasing population and more housing results in more strain on municipal services and utilities.
In this section, the terms “housing units” and “housing permits” will be used frequently, and it is important to note the difference. “Housing permits” are permits issued by each municipality but do not indicate whether or not a structure was, in fact, built. “Housing units” refer to units that have been permitted and physically built.
The number of housing permits issued between 2000 and 2020 rose and fell reflecting economic trends (Figure 2.1). In the early 2000s, single family permits constituted the majority issued, with a high in the year 2000 of 1,513 permits. Since then, variables such as economic health and available land have shifted the metric. Following the 2008 recession, multi-unit permits have been rising from 216 permits issued in 2009 to a high of 727 permits issued in 2018. In the year 2020, coinciding with the pandemic, multi-unit permits fell to 361 and single-family permits increased to 628.
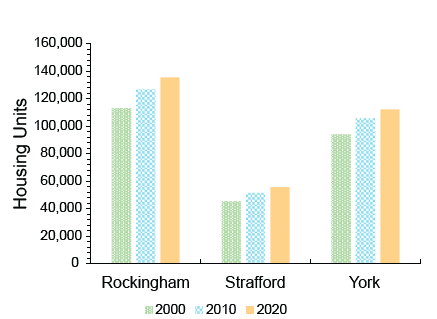
Total housing units encompass all housing permitted and built from 2000 to 2020, including single-family, multi-unit, manufactured homes, and conversion of existing single units into condominiums and apartments. Currently there are a total of 303,242 housing units in the three counties (Rockingham, Strafford, and York) across the Piscataqua Region Watershed (Figure 2.2). This equates to a 20% increase in total units since 2000 and a 7% increase since 2010. Also included in these figures are unoccupied housing units, which are defined as units that are kept as second homes, vacant, condemned, or for sale with no current residents.
Single family homes make up most of the new and existing housing in the area (Figure 2.1). Rockingham, Strafford, and York Counties all have between 60 – 75% of their housing stock reported as single-family units. Multi-units make up 20 – 30%, and manufactured homes account for less than 10% in all three areas. “Manufactured” refers to prefabricated homes (including but not limited to trailers) that are not built on site.
A 2021 report stated a goal to build 13,500 new housing units by 2024 to meet the current market demand in New Hampshire.3 Although this includes the entire state, we know that the population density and economic centers fall disproportionately in the Rockingham and Strafford County areas, two of the three counties in the Piscataqua Region Watershed. Rockingham County has seen an increase in housing units of 1,116 units per year since the year 2000. Strafford County sits at about half of this with 508 units per year, and York County housing units have increased by an average of 898 units (Table 2.1).
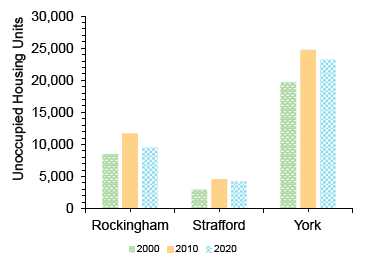
In order to meet housing needs, it is also important to consider occupancy of existing housing stock. For example, in 2020 there were an estimated 37,077 unoccupied housing units in the Piscataqua Region Watershed (Figure 2.3). Unoccupied housing includes second or vacation homes, vacant properties, condemned properties, and for-sale units (with no current residents). Unoccupied housing reached a peak in 2010 and has decreased only slightly in the past decade.
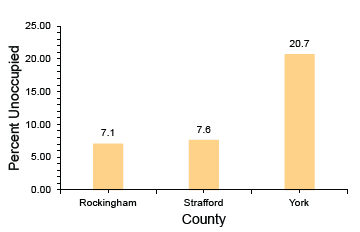
In York County, 20.7% of all the housing units fall into the ‘unoccupied’ category, meaning more than 1 in 5 housing units has no permanent residents (Figure 2.4). This metric is lower in both New Hampshire counties where the percent unoccupied is 7.1% and 7.6% for Rockingham and Strafford, respectively.
Acknowledgments and Credit
Nathaniel Gruen (PREP/UNH), Abigail Lyon (PREP), and Kalle Matso (PREP).

Figure 2.1: Housing permits issued in New Hampshire in the Piscataqua Region Watershed between 2000 and 2020, for both single and multi-family units.
Data source: NH Department of Business and Economic Affairs

Figure 2.2: Total housing units in Piscataqua Region Watershed 2000 to 2020.
Data source: US Census, 2020, 2010, 2000

Table 2.1: Housing unit change in counties of the Piscataqua Region Watershed.
Data source: US Census, 2020

