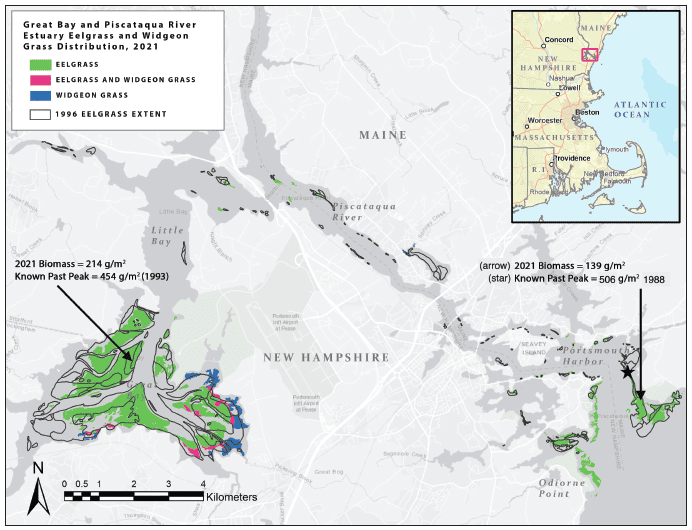
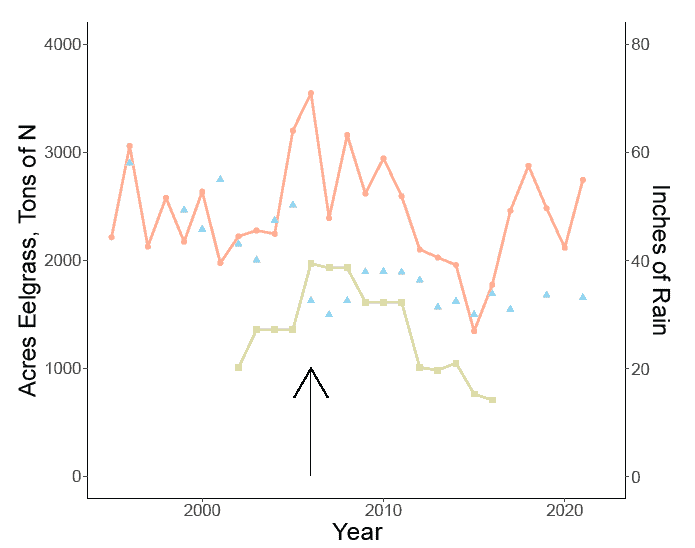
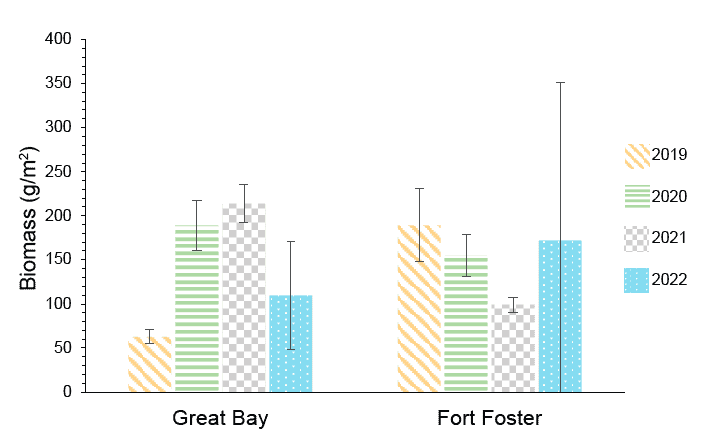
To assess eelgrass, we map the number of acres of habitat and then determine how much eelgrass is growing in those habitats, because eelgrass meadows can become less dense and have. less biomass (weight of plant material per area) when they are struggling. When eelgrass biomass decreases, beneficial functions, such as habitat for fish and shellfish, wave dampening, etc., also decrease. Based on 2021 data, the total acreage of eelgrass (1,654 acres) in the Great Bay Estuary has not changed notably since 2017 (Figure 11.1, Figure 11.2). The biomass of eelgrass at the deepest SeagrassNet monitoring site in the Great Bay shows overall improvement from 2019 to 2021 before a decrease in 2022. Eelgrass at the deepest site In Portsmouth Harbor decreased between 2019 and 2021 before increasing in 2022, finishing with little net change when compared to 2019 (Figure 11.3).
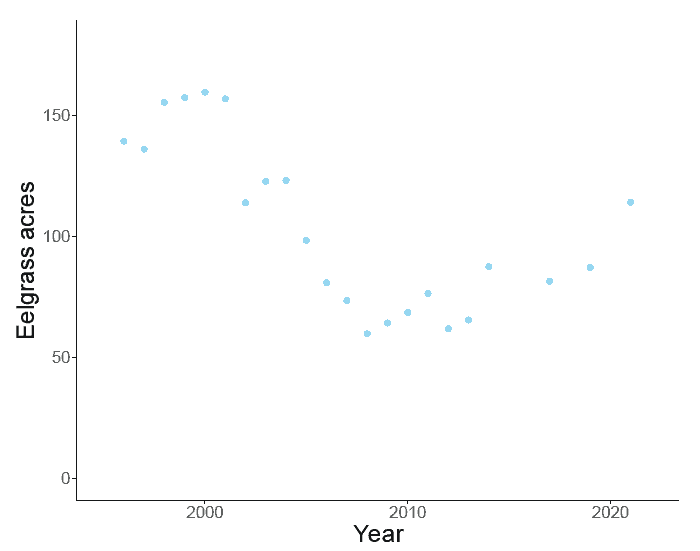
Total acreage of eelgrass in 2021 represents losses in some parts of the Great Bay Estuary and gains in others. For example, roughly 100 acres of eelgrass were lost in the Great Bay since 2019, especially in shallow regions of the southern portion of the Great Bay. On the other hand, there were considerable gains in acres of eelgrass in the Portsmouth Harbor and Rye coastal areas, with the highest acreage of eelgrass near Odiorne Point since we began regular monitoring in 1981. In 2021, Portsmouth Harbor had 114 acres, up from 60 acres in 2010 (Figure 11.4).
These data tell a complex yet common story of eelgrass that occurs in many estuaries from North Carolina to Prince Edward Island, Canada. Eelgrass is a plant sensitive to several stressors including wasting disease, temperature, habitat disturbance, and predation. Most commonly, excessive nutrients and sediments contribute to eelgrass decline. Nutrients, such as nitrogen, spur the growth of seaweed, epiphytes (algae growing on eelgrass leaves), and phytoplankton, which then outcompete eelgrass for light. Suspended sediments, too, block light from eelgrass, which needs much more light than most algal competitors. The “Total Suspended Solids” and “Phytoplankton” sections review data indicating increasing trends in these light-blocking constituents over time.
Eelgrass is also sensitive to warming waters, a phenomenon that is occurring all along the US East Coast. This can create a “habitat pinch,” where shallow waters can have good water clarity but are too warm, and the deeper waters are cooler but difficult for eelgrass because not enough light gets to the seafloor.
The relative role of different stressors on eelgrass in the Great Bay Estuary is a topic of ongoing research. The overall trend of eelgrass acres is inversely related to nitrogen loading and precipitation (Figure 11.2), at least through 2010, but does not necessarily indicate a cause-and-effect relationship. Nitrogen loading and precipitation track each other closely, because much more nitrogen enters the system when it rains, both from non-point and point sources. The same can be said for sediments and colored dissolved organic matter; large rain events wash material from the landscape into the tributaries and estuaries. Also, strong winds can stir up existing sediments, which also blocks light from reaching eelgrass. In rare cases, the salinity of the Great Bay Estuary can be greatly reduced, as happened during the Mother’s Day Storm of 2006 (Figure 11.2). These conditions, along with the erosive force of extreme freshwater flow events, can cause significant stress to eelgrass habitats, which prefer salinity levels to be 15 ppt or higher. While the 2006 storm coincides with a notable decrease in the number of acres of eelgrass, Figure 11.2 also suggests that a downward trend in eelgrass acreage was underway before this storm.
Since the Mother’s Day storm in 2006, the number of eelgrass acres in the estuary has remained relatively flat (Figure 11.2) even as nitrogen load continues to decrease and despite some years with low precipitation. On the other hand, over the same time period, eelgrass acreage in Portsmouth Harbor decreased in the years following the storm and then began to increase starting in 2010 (Figure 11.4).
The difference in eelgrass trends between Portsmouth Harbor and Great Bay is not completely understood, and might be related to hydrodynamic, sediment, temperature, and ecological differences between the two areas. In the Great Bay, water remains “in residence” much longer; it takes 10 days for 50% of the water particles to leave the Bay. At the mouth of the Estuary, in contrast, 90% of the water particles flow to the ocean or upriver (depending on the tide) within a day. Also, the Bay is much shallower than Portsmouth Harbor. In fact, much of the Bay turns into a mudflat at low tide. Therefore, the sediments in Great Bay are fine grained organic muds, in comparison with the coarse sands found in Portsmouth Harbor. This means that the sediments in Great Bay are more easily resuspended. Fine sediments tend to also have higher nutrient concentrations than coarser sediments and can release them slowly — years and sometimes decades later.
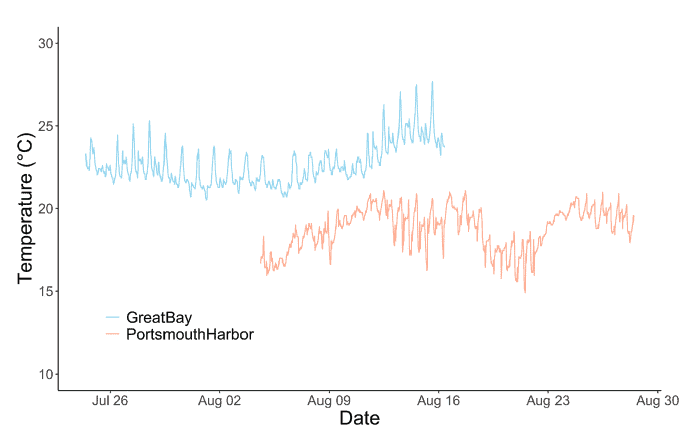
In addition, much of the eelgrass in Great Bay is growing in very shallow water and, therefore, is more susceptible to temperature stress (Figure 11.5). In contrast, for the Portsmouth Harbor eelgrass beds — despite the Gulf of Maine experiencing rapidly warming water — temperatures do not rise above 25° C (the threshold stress point for eelgrass)39 even at the shallow eelgrass beds (Figure 11.5). Finally, the two areas may host different types and proportions of fauna that can exert top-down effects on eelgrass or eelgrass habitat.
Acknowledgments and Credit
Kalle Matso and Trevor Mattera (PREP), with contributions from Michael Routhier (UNH), Ray Grizzle (UNH), Krystin Ward (UNH), Tom Gregory (UNH), Amanda Giacchetti (UNH), Lara Martin (UNH), and David Burdick (JEL/SMSOE/UNH).
