Bacteria
Bacteria
How have concentrations of bacterial indicators of fecal contamination changed over time in the Great Bay Estuary?
Tracking data from bacterial indicators suggest that ongoing management actions within the watershed have reduced levels of fecal contamination. Over the long-term (1988 to present), bacterial indicator levels have decreased estuary-wide; however, there have been no significant trends at the routinely monitored sites over the past six years. Monitoring for bacteria in the Hampton-Seabrook Estuary is currently being developed and will be included in future reports.
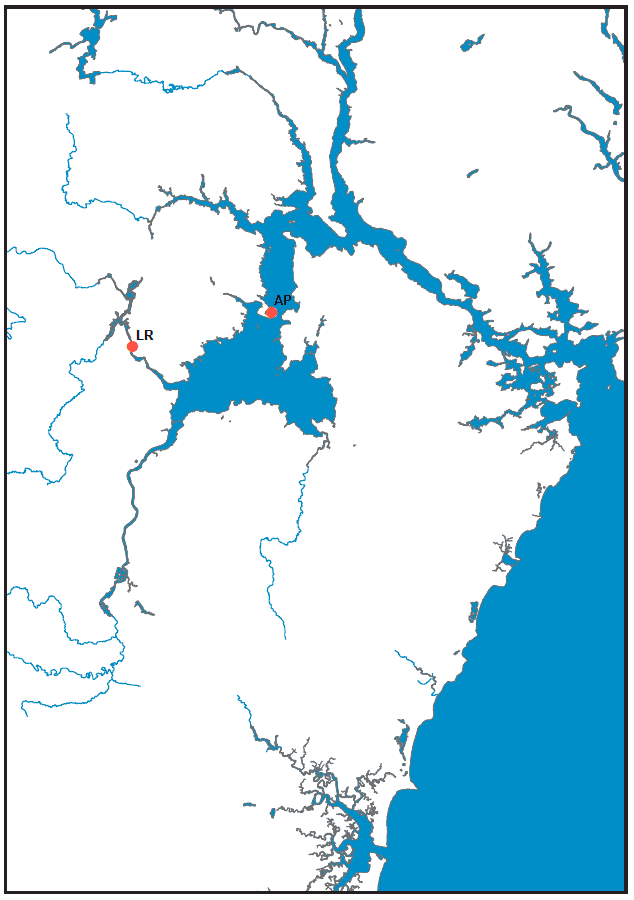
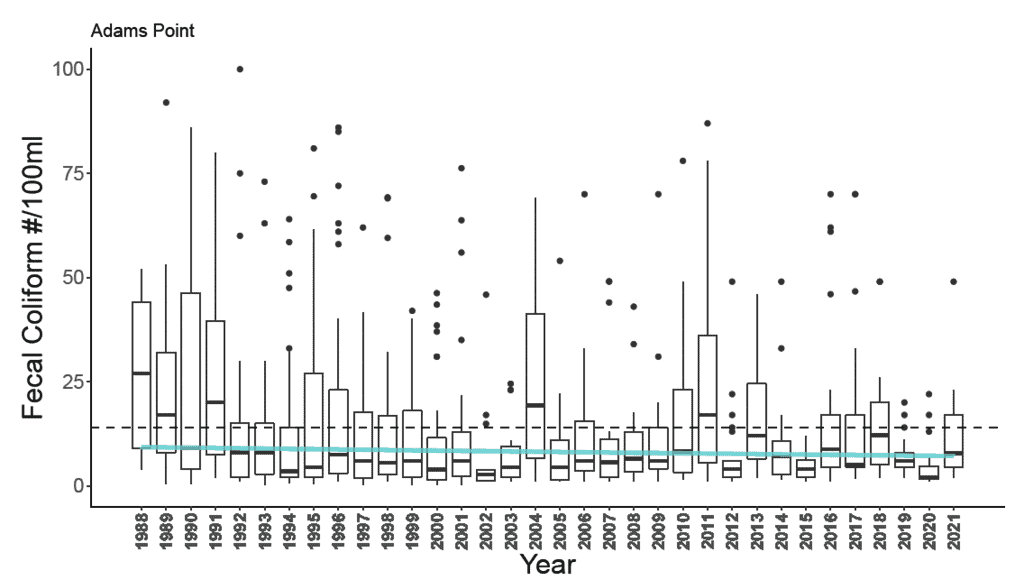
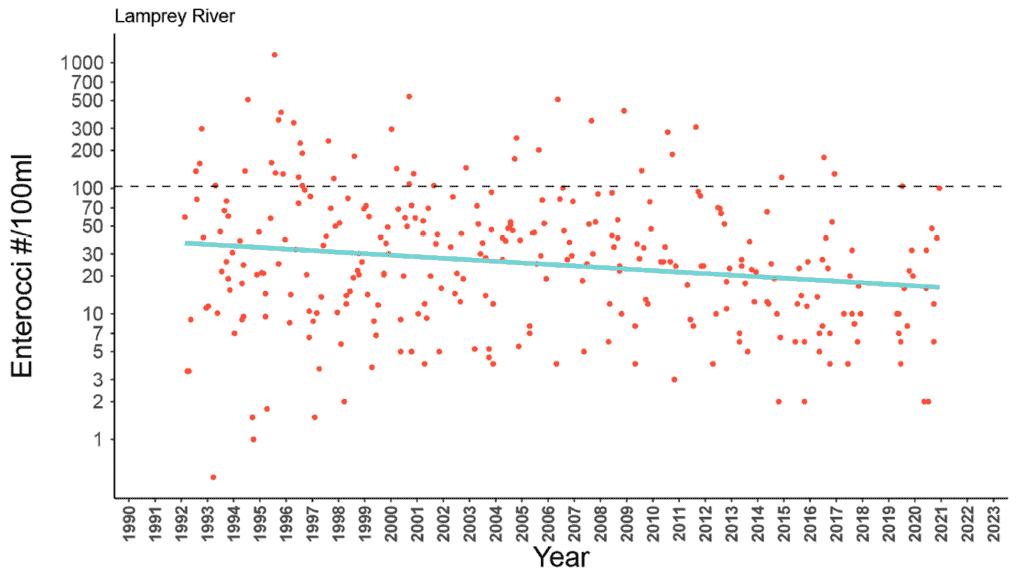
Long-term data for tracking baseline (dry weather) trends in fecal indicator bacteria are only available for two currently monitored sites, Adams Point and the Lamprey River (Figure 15.1). At both sites, the long-term trends for enterococci, fecal coliforms, and E. coli have decreased since the last report, issued in 2018. This can be attributed, in part, to improved stormwater infrastructure and wastewater treatment at all facilities in the watershed. There was a significantly decreasing trend in the annual average concentration data (1988 – 2021) of fecal coliforms at Adams Point (Figure 15.2). Enterococci concentrations in the Lamprey River have significantly decreased from 1990 – 2021 (Figure 15.3).
The monitoring protocol is set up to assess baseline conditions and so it avoids wet weather, known to cause elevated contamination levels in the Great Bay Estuary.44 However, since our region is forecast to receive more extreme precipitation events, these data do not reflect typical conditions, but rather, dry conditions.
State standard concentrations are included for each graph in Figures 15.2 and 15.3 as a reference, though the analysis procedures used for these data are slightly different than those required for assessing water quality classifications. Recent (2016 – 2021) levels of fecal coliforms at Adams Point (less than 5 colony forming units/100 mL) and enterococci levels in the Lamprey River (less than or equal to 24 colony forming units/100 mL) have, on average, remained below these reference concentrations, indicating acceptable quality. Generally, fecal indicator bacteria are present at elevated levels in estuarine tributaries that include urban centers at the head-of-tide, where there are more non-point sources, making the origin of pollution difficult to pinpoint. Head-of-tide urban centers may also have wastewater treatment facility discharges and significant impervious surfaces that cause runoff and increased stormwater-related contamination.
Excessive fecal indicator bacteria levels can be managed in various ways, informed by additional laboratory tests — microbial source tracking — that can identify the sources of the contaminating bacteria (e.g., humans, dogs, wildlife). This tracking tool can help managers identify a specific source so that the problem can be effectively addressed (e.g., replacement of a failed septic tank, education to manage pet waste). An ongoing study in the Lamprey River is using this tool to inform how best to ensure that river water quality is safe for recreational uses.45
Other bacteria of public health concern include Vibro and some other naturally occurring bacterial species that are not a result of fecal pollution. The dramatic increasing trend in illnesses over the past 15 years, including gastroenteritis and wound infections, caused by Vibro species in the Northeast46 is a regionally significant concern as coastal waters continue to warm.47 Vibrio parahaemolyticus populations are increasing in the Northeast and in the Great Bay Estuary;48 however, there have been only rare illnesses to date from exposure to New Hampshire coastal waters and shellfish.
Acknowledgments and Credit
Stephen Jones (NH Sea Grant/UNH).

Figure 15.1: Monitoring stations for bacteria at Adams Point (AP) and Lamprey River (LR)
Data source: Jackson Estuarine Lab, UNH

Figure 15.2: Long-term trends for monthly fecal coliform concentrations at Adams Point grouped by year. The dashed line shows the New Hampshire State standard for fecal coliforms (14/100 mL). Boxes encompass the middle 50% of the data points. The horizontal line in each box is the median and the vertical whiskers encompass the remaining data. “Outliers” are shown as individual points. The solid blue line indicates a statistically significant trend. The fecal coliform indicator, the standard for shellfish regulation, is used at this location due to the prevalence of shellfish harvesting in the area. Typically, nine samples are taken per year, from April through December.
Data source: Jackson Estuarine Laboratory, UNH

Figure 15.3: Long-term trends for monthly enterococci concentrations at the Lamprey River plotted on a log-scale, grouped by year. The dashed line shows the New Hampshire State standard for enterococci (104/100 mL). The blue line indicates a statistically significant trend. The enterococci indicator, the standard for marine recreation, is used at this location due to the prevalence of boaters, stand-up paddlers, etc. on the Lamprey River. Typically, nine samples are taken per year, from April through December. Data source: Jackson Estuarine Laboratory, UNH
Bacteria – Extended Report
Includes methods, data, and additional discussion not included in the Printed Edition.